Last month, local residential real estate transactions remained at peak levels, with 740 homes trading hands in LSTAR’s jurisdiction – only 22 less than three years ago, when the Association had its best February sales ever.
"Overall, home sales took a leap over the previous month – from 568 to 740, which signals an early start of a busy spring market," said 2020 LSTAR President Blair Campbell.
Compared to a year ago, the local residential sales activity saw a 23.7% increase, while the overall average home price experienced a 13% surge, rising to $445,535 in February.
"Even though the number of LSTAR new listings grew to 1,034, which is almost on par with the 10-year average, the number of active listings at month end was still much lower than normal. This reflects the strong demand for residential properties in our area," stated Campbell.
Inventory is another important measure of the balance between sales and the supply of listings. This shows how long it would take to liquidate existing inventories at the current rate of sales activity. At the end of February 2020, there were only 1.8 months of inventory across the entire LSTAR district – the lowest level in the last ten years.
"Looking at the home sales activity in LSTAR's five main regions, it's interesting to see that three of them – Elgin County, Middlesex County and Strathroy – had their second best February ever. London witnessed its third best February with 488 home sales, while St. Thomas set a new absolute record for February home sales, with 68," Campbell noted.
"However, if you will dig deeper into the London statistical figures, you will be surprised to discover that London South's February home sales reached their highest peak ever. This demonstrates, once again, that real estate is local and that, if you're looking for real estate information or guidance, a local REALTOR® is your best bet," Campbell emphasized.
The following table illustrates last month's average home prices in LSTAR's main regions and how they compare to the values recorded at the end of February 2019.
|
Area |
February 2020 Average Sale Price |
Change over February 2019 |
|---|---|---|
| Elgin County | $387,800 | ↑7.5% |
| London | $447,860 | ↑10.4% |
| Middlesex County | $507,284 | ↑ 9.1% |
| St. Thomas | $376,134 | ↑22.0% |
| Strathroy | $489,381 | ↑32.6% |
| LSTAR | $445,535 | ↑ 13.0% |
"Analyzing average prices in London's three main geographic areas, it is worth to note that London East saw the biggest year-over-year increase," Campbell added.
The average home price in London East was $369,094, up 21.8% from last February, while London North saw an increase of only 6.1% over last February, with an average home sales price of $530,042. In London South, the average home price was $437,667 – up 11.5% over February 2019.
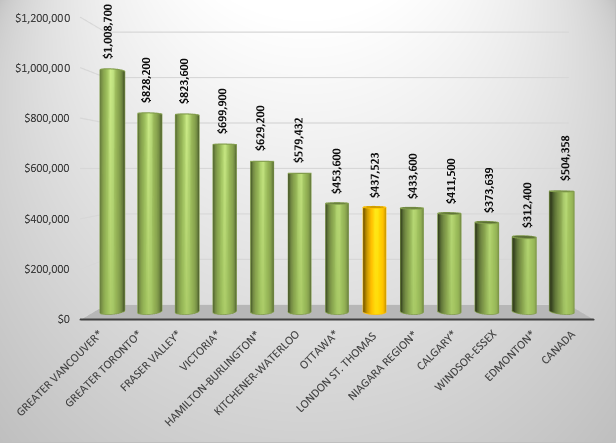
The following chart is based on data taken from the CREA National Price Map for January 2020 (the latest CREA statistics available). It provides a snapshot of how home prices in London and St. Thomas compare to some other major Ontario and Canadian centres.
According to a research report[1], a total of $67,425 in ancillary expenditures is generated by the average housing transaction in Ontario over a period of three years from the date of purchase.
"This means that our February home sales would bring more than $49 million back into the local economy throughout the period 2020 - 2022," Campbell concluded.
The London and St. Thomas Association of REALTORS® (LSTAR) exists to provide its REALTOR® Members with the support and tools they need to succeed in their profession. LSTAR is one of Canada’s 15 largest real estate associations, representing over 1,900 REALTORS® working in Middlesex and Elgin Counties, a trading area of 500,000 residents. LSTAR adheres to a 'Quality of Life' philosophy, supporting growth that fosters economic vitality, provides housing opportunities, respects the environment and builds good communities and safe neighbourhoods and is a proud participant in the REALTORS Care Foundation’s Every REALTOR™ Campaign.
[1] Economic Impacts of MLS® Systems Home Sales and Purchases in Canada and the Provinces, Altus Group Economic Consulting, 2017.
*Areas displaying MLS® Home Price Index benchmark prices; all other areas display average prices