LSTAR REALTORS® started the year with a bang, as the house sales in the London – St Thomas area saw their second best January since 1978, when LSTAR started tracking its markets’ performance.
568 homes exchanged hands last month in our jurisdiction – only two shy from the same period in 2017, which still holds the absolute record for January residential real estate transactions.
The average home price for the region was 437,197, 13.9% higher than a year ago and 48.2% over January 2017. “When compared to January 2010, the percentage of price growth is a whopping 95.2%, which means that the value of homes in our area has almost doubled in the last ten years,” said 2020 LSTAR President Blair Campbell.
“Despite the high number of home sales and the increasing house prices, the number of new listings that hit the local market in January 2020 saw a 9.4% increase over last year, which brought last month’s sales-to-new-listings ratio to 60.5%. This increase in listings for the month is fantastic as the lack of inventory has been a significant concern over the past two years,” he added.
Inventory is another important measure of the balance between sales and the supply of listings. This shows how long it would take to liquidate existing inventories at the current rate of sales activity. At the end of January 2020, there were 2.2 months of inventory across the entire LSTAR district – the lowest level in the last ten years.
The following table illustrates last month’s average home prices in LSTAR’s main regions and how they compare to the values recorded at the end of January 2019.
|
Area |
January 2020 Average Sale Price |
Change over January 2019 |
|---|---|---|
| Elgin County | $410,314 | ↑25.6% |
| London | $452,924 | ↑16.8% |
| Middlesex County | $482,669 | ↓ 2.3% |
| St. Thomas | $384,291 | ↑12.0% |
| Strathroy | $452,960 | ↑13.8% |
| LSTAR | $437,197 | ↑ 13.9% |
“Looking at London’s three main geographic areas, it’s worth to note that January was a record month for home sales activity in London South, which also includes data from the west side of the city,” Campbell stated. “This area had its best January ever, with 139 house sales and an average home price of $464,862 - 22% higher than one year ago and 93.2% more than 10 years ago,” he emphasized.
The average home price in London East was $388,161, up 22.3% from last January, while London North saw an increase of only 5.4% over last January, with an average home sales price of $503,576.
“Two other LSTAR regions that saw record home sales in January were Elgin County - with 42 residential transactions and Middlesex County – with 49. On the other hand, in both St. Thomas and Strathroy, home sales were on par with the ten year average – with 41, respectively 15 real estate transactions,” Campbell observed.
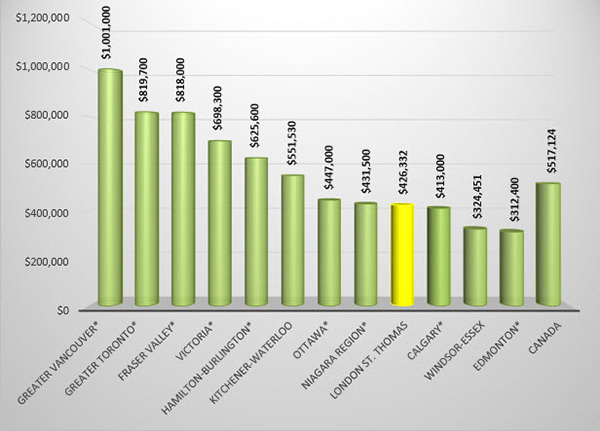
The following chart is based on data taken from the CREA National Price Map for December 2019 (the latest CREA statistics available). It provides a snapshot of how home prices in London and St. Thomas compare to some other major Ontario and Canadian centres.
According to a research report[1], a total of $67,425 in ancillary expenditures is generated by the average housing transaction in Ontario over a period of three years from the date of purchase. "This means that our January home sales would translate into more than $38 million back into the local economy for the period 2020 - 2022," Campbell concluded.
The London and St. Thomas Association of REALTORS® (LSTAR) exists to provide its REALTOR® Members with the support and tools they need to succeed in their profession. LSTAR is one of Canada’s 15 largest real estate associations, representing over 1,900 REALTORS® working in Middlesex and Elgin Counties, a trading area of 500,000 residents. LSTAR adheres to a Quality of Life philosophy, supporting growth that fosters economic vitality, provides housing opportunities, respects the environment and builds good communities and safe neighbourhoods and is a proud participant in the REALTORS Care Foundation’s Every REALTOR™ Campaign.
*Areas displaying MLS® Home Price Index benchmark prices; all other areas display average prices.
[1] Economic Impacts of MLS® Systems Home Sales and Purchases in Canada and the Provinces, Altus Group Economic Consulting, 2017.