1,049 homes were sold in March 2022 in the London-St. Thomas area via LSTAR’s MLS® System. During the same time frame, 1,544 listings came on the local market, which makes last month the March with the highest number of listings in the history of the London and St. Thomas Association of REALTORS®.
“Despite the record number of listings, our inventory – the number of active listings at month end – saw just a slight increase from last month, creeping up from 0.5 months to only 0.6,” said Randy Pawlowski, 2022 LSTAR President. “The sales-to-new-listings ratio for the entire jurisdiction of LSTAR was 67.9%, much lower than a year ago, but still indicating a Sellers’ market,” he continued. “The latest interest rate hike by the Bank of Canada may have put a damper on what has been so far a truly fierce competition among local home buyers,” he explained.
In March, the overall average price for all home types in our area was $823,954, whereas LSTAR’s composite MLS® Home Price Index Benchmark Price sat at $774,200. “These figures suggest that the pace of home price gains might have started to slow down in our area,” Pawlowski said. “It’s way too early to predict the impact of this new measure, but Ontario Government’s recent decision to increase the non-resident speculation tax to 20% and expand it throughout the whole province might also help tame home prices,” he added.
The following table shows how March’s average home sales prices in LSTAR’s five main regions compare to the benchmark prices for the same areas.
|
Area |
March 2022 MLS® HPI Benchmark Price |
March 2022 Average Price |
|---|---|---|
| Central Elgin | $826,600 | $927,880 |
| London East | $685,600 | $669,005 |
| London North | $894,800 | $947,700 |
| London South | $770,100 | $823,904 |
| Middlesex Centre | $1,085,800 | $1,228,124 |
| St. Thomas | $665,200 | $728,860 |
| Strathroy-Caradoc | $869,200 | $860,138 |
| LSTAR | $774,200 | $823,954 |
Out of the 1,049 units sold last month, 756 were single-family homes, 140 – condo townhouses, and 107 – apartments.
“In March, the average price for a single-family home in LSTAR’s jurisdiction sat at $894,306, that of a condo – at $692,187 and the overall average price for an apartment – at $501,961,” Pawlowski said. “Regarding condo townhouses, it’s interesting to see how well they are selling and how much their benchmark price has appreciated in the last year: last month was LSTAR’s second-best March for condominium sales and the MLS® HPI benchmark price for a local apartment has grown by 49.7% over a year ago,” he noted.
The following table shows the March benchmark prices for all housing types in LSTAR’s jurisdiction and how they compare with the values from a year ago.
|
MLS® Home Price Index Benchmark Prices |
||
|---|---|---|
|
Benchmark Type |
March 2022 |
Change over March 2021 |
| LSTAR Composite | $774,200 | ↑ 35.9% |
| LSTAR Single-Family | $831,100 | ↑ 33.4% |
| LSTAR One Storey | $777,900 | ↑ 40.1% |
| LSTAR Two Storey | $884,700 | ↑ 29.3% |
| LSTAR Townhouse | $638,700 | ↑ 49.7% |
| LSTAR Apartment | $445,100 | ↑ 36.5% |
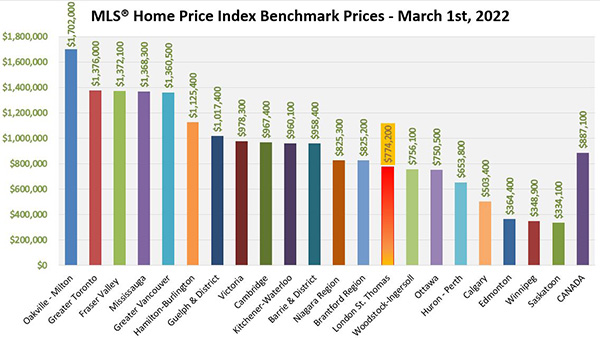
“The latest figures achieved by LSTAR’s HPI benchmark prices and average sale prices place our area somewhere in the middle of the Canadian home affordability scale,” Pawlowski observed. The following table is based on data provided by the Canadian Real Estate Association (CREA) for March 1st, 2022.
According to a research report[1] by Altus Group, a total of $73,250 in ancillary expenditures is generated by the average housing transaction in Ontario over a period of three years from the date of purchase. "This means that our March home sales could potentially pour over 76 million into the local economy’s coffers over the next three years, which goes to show why the real estate industry is considered one of the main drivers of the local economy,” Pawlowski concluded.
[1]Economic Impacts of MLS® Systems Home Sales and Purchases in Canada and the Provinces, Altus Group, 2019


