The London and St. Thomas Association of REALTORS® (LSTAR) region remains a vibrant market for both buyers and sellers. September’s market activity and year-to-date figures show encouraging trends.
In September 2024, 562 homes were sold, representing a 6.0% increase from September 2023 and a 0.5% rise from September 2022. The average home price was $641,583, reflecting a 1.7% increase from September 2023 but a slight 1.0% decrease from September 2022. We had 1,569 new listings last month. LSTAR also recorded 3,049 active listings, an increase of 19.8% from the same time last year.
LSTAR Chair Kathy Amess commented, "The London and St. Thomas area continues to be a great region for both buyers and sellers. We saw some positive signs in September’s market as well as our year-to-date activity showing modest increases. The Bank of Canada rate decrease in early September was a welcome adjustment that may have been a factor, and we hope this trend continues throughout the fall.”
The table below displays September average prices and MLS® HPI Benchmark Prices in LSTAR's main regions supplied by the Canadian Real Estate Association (CREA).
Area | September 2024 MLS® | September 2024 |
|---|---|---|
| Central Elgin | $659,700 | $730,156 |
| London East | $489,600 | $507,207 |
| London North | $709,600 | $722,481 |
| London South | $609,500 | $622,125 |
| Middlesex Centre | $852,900 | $991,784 |
| St. Thomas | $570,200 | $574,350 |
| Strathroy-Caradoc | $802,700 | $614,676 |
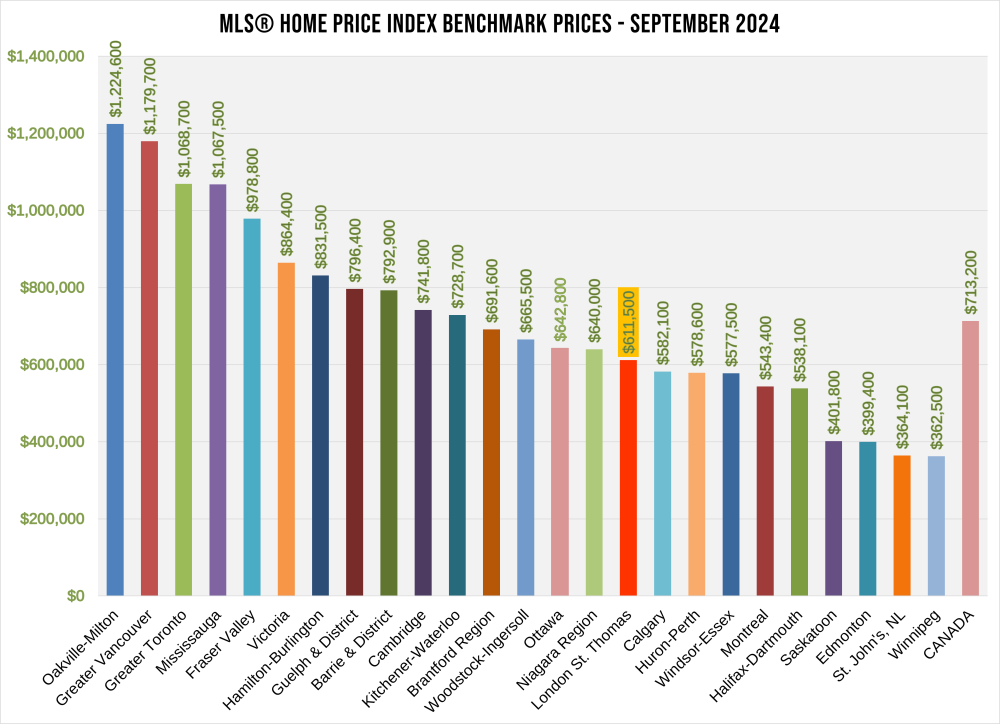
| LSTAR | $611,500 | $641,583 |
The HPI benchmark price reflects the value of a “typical home” as assigned by buyers in a certain area based on various housing attributes, while the average sales price is calculated by adding all the sale prices for homes sold and dividing that total by the number of homes sold. The HPI benchmark price is helpful to gauge trends over time since averages may fluctuate by changes in the mix of sales activity from one month to the next.
The table below presents the benchmark prices for all housing types within LSTAR’s jurisdiction for September, along with comparisons to the previous month and three months ago.
MLS® Home Price Index Benchmark Prices | |||
|---|---|---|---|
| Benchmark Type | September 2024 | Change Over August 2024 | Change Over June 2024 |
| LSTAR Composite | $611,500 | ↓1.9% | ↓1.0% |
| LSTAR Single-Family | $659,800 | ↓1.4% | ↓0.7% |
| LSTAR One Storey | $603,900 | ↑1.6% | ↑1.4% |
| LSTAR Two Storey | $704,200 | ↓3.2% | ↓1.8% |
| LSTAR Townhouse | $496,000 | ↑2.7% | ↓4.0% |
| LSTAR Apartment | $395,600 | ↓7.4% | ↑1.8% |
In September 2024, the composite benchmark price for homes within LSTAR’s jurisdiction was $611,500, reflecting a slight decrease of 1.9% from the previous month and 1.0% from three months ago. Single-family homes had a benchmark price of $659,800, down 1.4% from last month and 0.7% from three months ago.
LSTAR Chair Kathy Amess: “The recent trends in benchmark prices reflect the ongoing adjustments in our housing market. While some segments, like one-storey homes, are seeing positive growth, others are experiencing declines. This market requires careful navigation, and LSTAR remains dedicated to providing our members and the community with the insights and support needed to make informed decisions.
The chart below provided by CREA shows the most recent HPI benchmark prices.
According to a recent study1 by Altus Group, an average housing transaction in Ontario generated an average of $88,966 in spin-off spending per transaction from 2020 to 2022. These expenses include legal fees, appraisers, moving costs, new appliances, and home renovation expenses.
Employment resulting from home sales is also significant, according to the Altus study. Resale housing activity created an estimated 106,565 jobs annually in Ontario from 2020 to 2022. Jobs include manufacturing, construction, finance, and insurance.
1Economic Benefits Generated by Home Sales and Purchases Over MLS® Systems in Canada, Altus Group, 2023.