The real estate market in February 2025 has shown a mix of stability and challenges. Sales activity saw a decline of 23.1% compared to February 2024, with 476 properties sold. Despite this, the dollar volume of sales reached $308,267,028, reflecting a 20.4% decrease from the previous year. New listings were down by 4.5%, totaling 1,026, while active listings increased by 24.1% to 2,233. The sales to new listings ratio stood at 46.4, indicating a balanced market.
The average price of single family detached homes in February 2025 was $706,174, a modest increase of 2.4% from February 2024. The median price, however, saw a slight decrease of 1.9%, settling at $645,000. The market's inventory levels have improved, with months of inventory rising to 4.4, providing more options for buyers.
Dale Marsh, LSTAR Chair, commented on the market trends: "External factors are beginning to shape the Canadian housing market in significant ways. U.S. tariffs on Canadian exports could increase inflation and reduce consumer confidence, further impacting the housing market. These factors, combined with supply chain disruptions and rising construction costs, suggest that the Canadian real estate market is navigating through a period of adjustment and adaptation."
Marsh continued, "The real estate market continues to undergo a period of adjustment. While sales activity has slowed, the increase in active listings and stable average prices are positive signs. Buyers now have more choices, and sellers are still seeing strong values for their properties. We remain optimistic about the market's stability and adaptability in the coming months."
The table below displays February’s average prices and MLS® HPI Benchmark Prices in LSTAR's main regions.
Area | February 2025 MLS® | February 2025 |
|---|---|---|
| Central Elgin | $631,800 | $631,238 |
| London East | $497,100 | $615,900 |
| London North | $723,800 | $714,921 |
| London South | $624,000 | $665,714 |
| Middlesex Centre | $885,000 | $724,900 |
| St. Thomas | $553,800 | $576,440 |
| Strathroy-Caradoc | $827,200 | $734,021 |
| LSTAR | $622,100 | $647,620 |
The HPI benchmark price reflects the value of a “typical home” as assigned by buyers in a certain area based on various housing attributes, while the average sales price is calculated by adding all the sale prices for homes sold and dividing that total by the number of homes sold. The HPI benchmark price is helpful to gauge trends over time since averages may fluctuate by changes in the mix of sales activity from one month to the next.
In February , the MLS® Home Price Index Benchmark Prices showed varied trends across different property types in Ontario. The LSTAR Composite price was $622,100, reflecting a 0.78% increase from January 2025 and a 1.62% rise from November 2024. Single-family homes were priced at $673,500, up by 1.28% from January and 1.58% from November. One-storey homes saw a notable increase to $608,100, with a 1.67% rise from January and 1.35% from November. Two-storey homes were priced at $728,000, showing a 1.06% increase from January and 1.35% from November. Townhouses were valued at $496,900, with a 0.95% increase from both January and November. However, apartment prices dropped significantly to $379,600, down by 7.62% from January, despite a 1.56% increase from November.
The following table displays February’s benchmark prices for all housing types within LSTAR's jurisdiction and shows how they compare with those recorded in the previous month and three months ago.
MLS® Home Price Index Benchmark Prices | |||
|---|---|---|---|
| Benchmark Type | February 2025 | Change Over January 2025 | Change Over November 2024 |
| LSTAR Composite | $622,100 | ↑0.78% | ↑1.62% |
| LSTAR Single-Family | $673,500 | ↑1.28% | ↑1.58% |
| LSTAR One Storey | $608,100 | ↑1.67% | ↑1.35% |
| LSTAR Two Storey | $728,000 | ↑1.06% | ↑1.35% |
| LSTAR Townhouse | $496,900 | ↑0.95% | ↑0.95% |
| LSTAR Apartment | $379,600 | ↓7.62% | ↑1.56% |
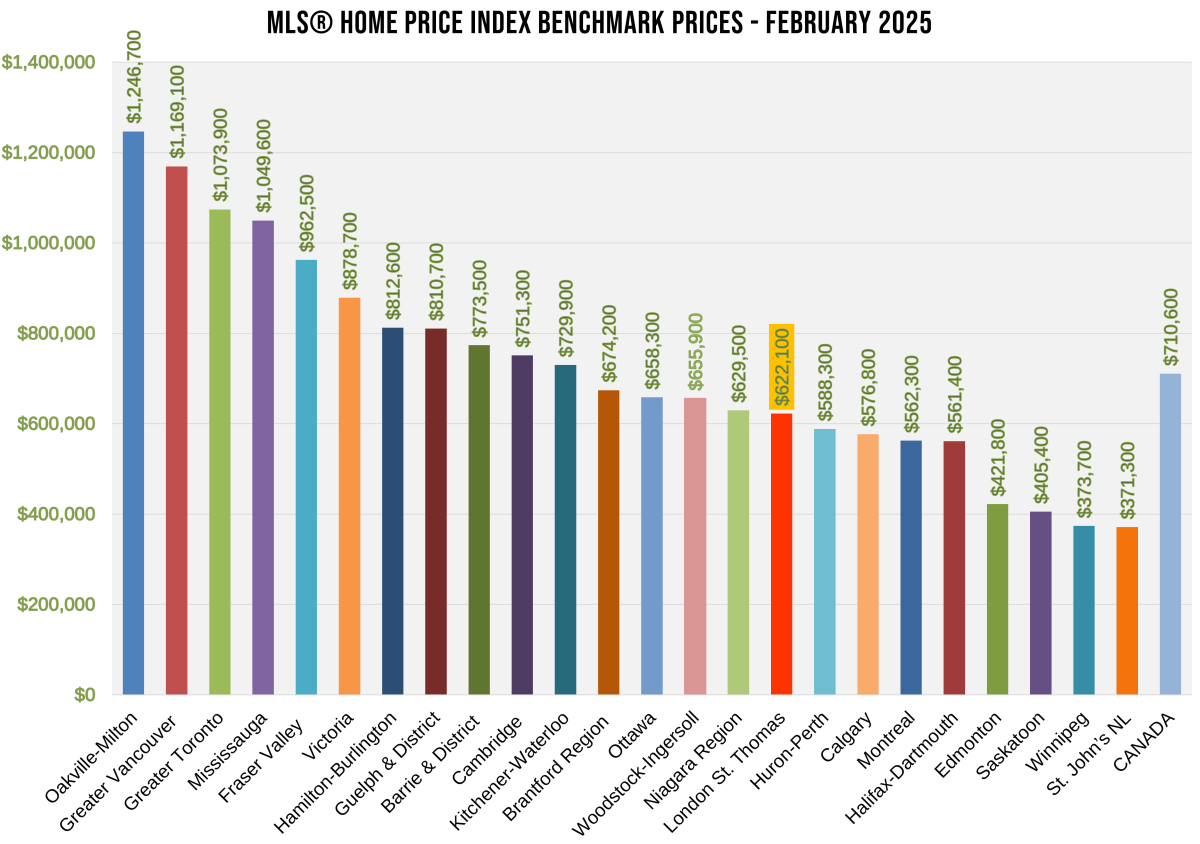
The chart below shows the most recent HPI benchmark prices across Canada.
According to a recent study1 by Altus Group, an average housing transaction in Ontario generated an average of $88,966 in spin-off spending per transaction from 2020 to 2022. These expenses include legal fees, appraisers, moving costs, new appliances, and home renovation expenses.
Employment resulting from home sales is also significant, according to the Altus study. Resale housing activity created an estimated 106,565 jobs annually in Ontario from 2020 to 2022. Jobs include manufacturing, construction, finance and insurance.
1Economic Benefits Generated by Home Sales and Purchases Over MLS® Systems in Canada, Altus Group, 2023.