The real estate market showcased several positive trends despite a temporary dip in sales activity. With 370 transactions, sales activity saw a decline of 20.3% compared to the previous year. However, the average home price remained robust at $639,486, marking a 4.5% increase from January 2024. This stability in pricing is a strong indicator that interest and demand in the market are still healthy.
Given the stable average prices and the rise in new and active listings, we are optimistic that sales activity will gain momentum in the coming months. The market fundamentals remain strong, and we anticipate a positive rebound in sales activity as we progress through the year.
LSTAR Chair Dale Marsh commented, "The increase in new and active listings is a positive indicator of a robust market. With more properties available, buyers have greater choices, and the steady rise in average prices demonstrates the continued confidence in our market. We are optimistic about the future and believe this trend will benefit both buyers and sellers in the coming months. Additionally, the recent lowering of interest rates in Canada is starting to have a positive impact on the real estate market. Lower borrowing costs are making homeownership more accessible, encouraging more buyers to enter the market and further driving demand. This trend is expected to support continued growth and stability in the housing sector."
The table below displays January’s average prices and MLS® HPI Benchmark Prices in LSTAR's main regions.
Area | January 2025 MLS® | January 2025 |
|---|---|---|
| Central Elgin | $635,800 | $741,488 |
| London East | $492,500 | $509,112 |
| London North | $722,500 | $714,565 |
| London South | $618,500 | $676,638 |
| Middlesex Centre | $822,500 | $1,116,615 |
| St. Thomas | $550,700 | $533,451 |
| Strathroy-Caradoc | $809,900 | $634,450 |
| LSTAR | $617,300 | $639,486 |
The HPI benchmark price reflects the value of a “typical home” as assigned by buyers in a certain area based on various housing attributes, while the average sales price is calculated by adding all the sale prices for homes sold and dividing that total by the number of homes sold. The HPI benchmark price is helpful to gauge trends over time since averages may fluctuate by changes in the mix of sales activity from one month to the next.
The following table displays January’s benchmark prices for all housing types within LSTAR's jurisdiction and shows how they compare with those recorded in the previous month and three months ago.
Comparing the MLS® Home Price Index Benchmark Prices from January 2025 to December 2024, we see the following changes:
- LSTAR Composite: Increased from $609,900 to $617,300, a rise of 1.2%.
- LSTAR Single-Family: Increased from $655,300 to $665,000, a rise of 1.5%.
- LSTAR One Storey: Increased from $588,000 to $598,200, a rise of 1.7%.
- LSTAR Two Storey: Increased from $710,500 to $720,300, a rise of 1.0%.
- LSTAR Townhouse: Decreased slightly from $495,000 to $492,200, a drop of 0.6%.
- LSTAR Apartment: Remained stable at $410,900, with no change from December 2024
These figures indicate a general upward trend in home prices across most property types, as we entered the new year.
MLS® Home Price Index Benchmark Prices | |||
|---|---|---|---|
| Benchmark Type | January 2025 | Change Over December 2024 | Change Over October 2024 |
| LSTAR Composite | $617,300 | ↑1.2% | ↑1.4% |
| LSTAR Single-Family | $665,000 | ↑1.5% | ↑1.5% |
| LSTAR One Storey | $598,200 | ↑1.7% | ↑2.4% |
| LSTAR Two Storey | $720,300 | ↑1.0% | ↑1.0% |
| LSTAR Townhouse | $492,200 | ↓0.6% | ↑1.0% |
| LSTAR Apartment | $410,900 | 0.0% | ↓0.3% |
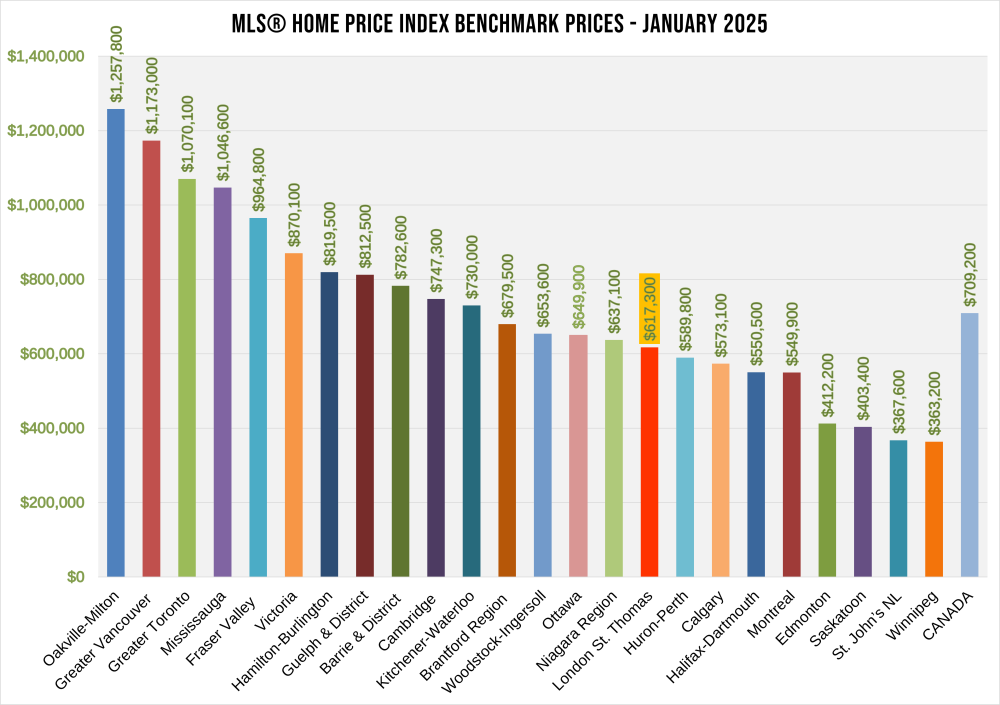
The chart below shows the most recent HPI benchmark prices across Canada.
According to a recent study1 by Altus Group, an average housing transaction in Ontario generated an average of $88,966 in spin-off spending per transaction from 2020 to 2022. These expenses include legal fees, appraisers, moving costs, new appliances, and home renovation expenses.
Employment resulting from home sales is also significant, according to the Altus study. Resale housing activity created an estimated 106,565 jobs annually in Ontario from 2020 to 2022. Jobs include manufacturing, construction, finance and insurance.
1Economic Benefits Generated by Home Sales and Purchases Over MLS® Systems in Canada, Altus Group, 2023.